Go Post-mortem
Introduction
Even if you write tests and those tests are perfect, effective and everything
you will face production issues. Sometimes everything will just crash and
when that’ll happen you’ll need some debugging skills.
Here I’m putting some flow examples, notes and resources around post-mortem debugging of
Go programs, including, but not limited to, those running inside a Kubernetes cluster.
I’m a huge fan of GDB, I used it for almost a decade now and while I remember it was a bit clunky and difficult at first but it got better in the years and in the meantime I got used to it and it’s commands and perks.
A few years after my first gdb, I saw Delve and had the same feeling: it was clunky, and it had nearly anything I needed. Now, after a couple of years Delve seems pretty complete and it just works, one thing I really like about Delve is that even if the terminal interface is similar to other debuggers (like gdb) has a very well done UX, for example:
This is the current execution point of a program under Delve:
    29:         for {
    30:                 select {
    31:                 case message := <-ch:
    32:                         fmt.Println(message)
    33:                 case <-time.After(time.Second * 3):
=>  34:                         panic("I'm panicking because of timeout!")
    35:                 }
    36:         }
    37: }
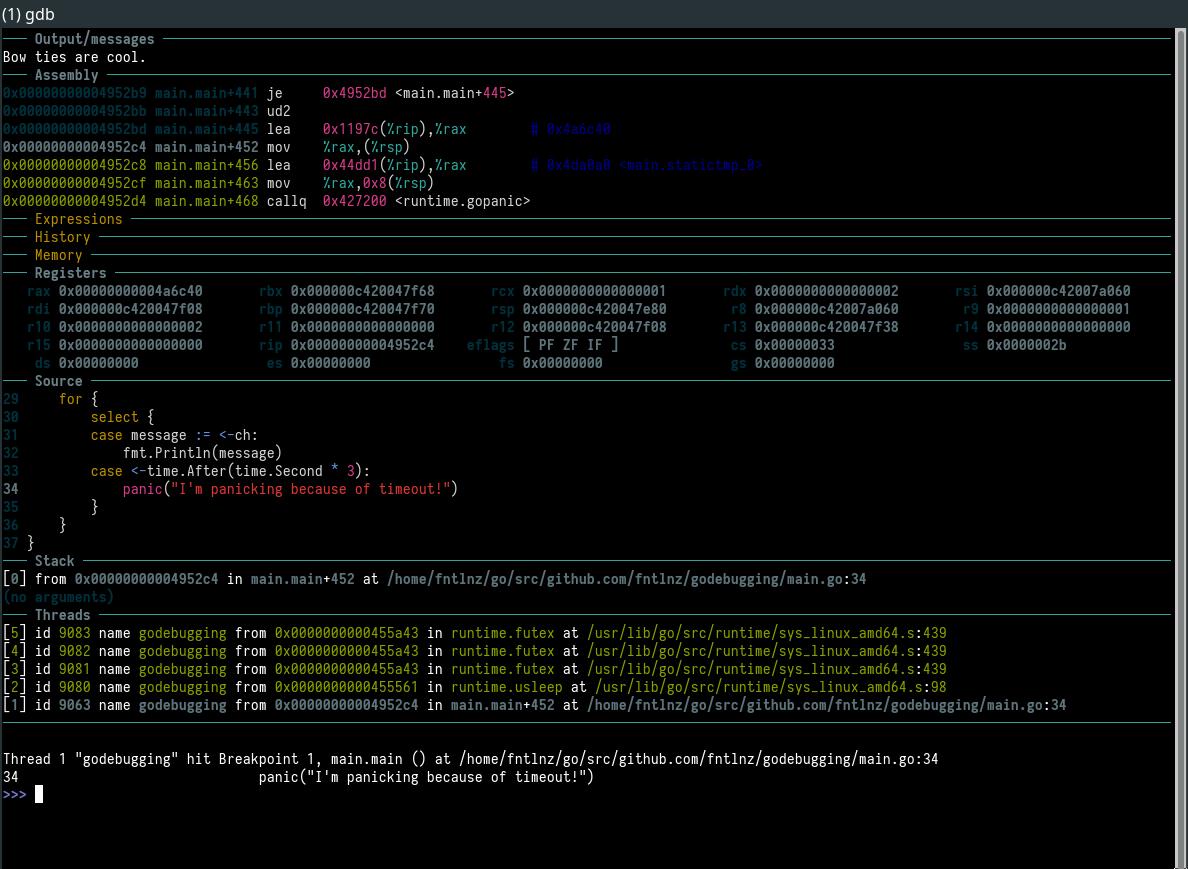
This is how the same thing looks like in GDB
30                      select {
31                      case message := <-ch:
32                              fmt.Println(message)
33                      case <-time.After(time.Second * 3):
34                              panic("I'm panicking because of timeout!")
35                      }
36              }
37      }
However, one could extend GDB by customizing .gdbinit like how the GDB Dashboard does:
A part from the UX, Delve has several advantages over GDB when debugging Go:
- It works out of the box - (Just Works™)
- Integrated with major editors: Vim/Nvim, Code, GoLand
- It has an impressivly well working support for Go concurrency patterns
- Even post-mortem core dump analysis works just right
On the other hand, GDB has still some advantages over it:
- It supports any architecture (Delve only amd64)
- It supports any OS (Delve only Linux, OSX and Windows)
- You can debug Cgo
- You need to extend your debugging to the Go runtime itself, GDB is your tool
So, how to say, I’m not very religious about the debugger I use but generally when I need to choose Delve or GDB I just go with Delve and then if Delve breaks I try with GDB. It’s not very scientific but it’s a wise way to proceed.
I will show a few examples:
- You need to debug an API server entirely written in Go, delve
- You need to debug some Go program orchestrating linux namespaces (like runc), delve breaks and I use GDB because in to interact with kernel features you need Cgo!
- You need to debug a program compiled for ppc64le? delve breaks, I use GDB
- You have a router mounting a mips processor and you want to debug your own DHCP written for it in Go? you know the debugger, true story.
See it? Straightforward!
Proceed with the Autopsy
When you do an autopsy over a crashed Go program there are two things you need:
- A core dump
- A non-stripped, with DWARF and debug symbols binary of your program
To get a core dump, the first thing you do is to check the maximum file size for a core dump file
ulimit -c
If it is zero, you are not core dumping so you need to raise the limit.
ulimit -c unlimited
Also, when debugging, you have to remember that the Go runtime can be said to trigger certain behavior that can make debugging easier. In this case, we are interested to say the Go runtime to trigger a core dump by actually doing a segfault instead of just exiting in case of panic.
To do so, when we run the Go program we need to run it with GOTRACEBACK=crash like this.
GOTRACEBACK=crash ./myprogram
There are also other environment variables and behaviors for GOTRACEBACK, if
you want to discover more take a look here.
Now that your system can core dump you need to restart the program and wait for it to crash.
OR
You can obtain the core file of a running program using gcore,
see man gcore for more info.
Core files in linux are written with a template
defined in /proc/sys/kernel/core_pattern
cat /proc/sys/kernel/core_pattern
|/usr/lib/systemd/systemd-coredump %P %u %g %s %t %c %e
In my case it is using the systemd-coredump program to write files, and I get
lz4 compressed files like this:
/var/lib/systemd/coredump/core.godebugging.1000.a0b55b870a3f443696cf7cb874d7f27b.32124.1515962062000000.lz4
Production just got hot
Generally speaking when a Go binary is built for production most of us will use something similar to:
go build -ldflags "-s -w" .
which has the effect of removing the symbol table and DWARF symbol table from the program.
Semi OT: if you are a digger, read this blog from Dave Cheney on what the Go build command does, you’ll see a few interesting things.
The good news is that we can analyze a core file with a binary built from the same source code, this time without those ldflags.
I don’t own the code
But in case you don’t have or own the source be aware that without a symbol table we can’t debug a program with Delve so with gdb and some Assembly skills you can use gdb to use the binary you have with the core file you got from the production system, then you can start analyzing what happened:
gdb ./godebugging core.1234

[New LWP 32124]
[New LWP 32125]
[New LWP 32126]
[New LWP 32127]
[New LWP 32128]
Core was generated by `./godebugging'.
Program terminated with signal SIGABRT, Aborted.
#0  0x0000000000455594 in ?? ()
[Current thread is 1 (LWP 32124)]

(gdb) bt
#0  0x0000000000455594 in ?? ()
#1  0x000000000043d10b in ?? ()
#2  0x0000000000000006 in ?? ()
#3  0x0000000000000000 in ?? ()

(gdb) x/30i $pc
0x455600:    sub    $0x18,%rsp
0x455604:    mov    %rbp,0x10(%rsp)
0x455609:    lea    0x10(%rsp),%rbp
0x45560e:    mov    0x10c96b(%rip),%rax        # 0x561f80
0x455615:    cmp    $0x0,%rax
0x455619:    je     0x45563f
0x45561b:    xor    %edi,%edi
0x45561d:    lea    (%rsp),%rsi
0x455621:    callq  *%rax
0x455623:    mov    (%rsp),%rax
0x455627:    mov    0x8(%rsp),%rdx
0x45562c:    mov    %rax,0x20(%rsp)
0x455631:    mov    %edx,0x28(%rsp)
0x455635:    mov    0x10(%rsp),%rbp
0x45563a:    add    $0x18,%rsp
0x45563e:    retq
0x45563f:    lea    (%rsp),%rdi
0x455643:    xor    %esi,%esi
0x455645:    mov    0xdaa7c(%rip),%rax        # 0x5300c8
0x45564c:    callq  *%rax
0x45564e:    mov    (%rsp),%rax
0x455652:    mov    0x8(%rsp),%edx
0x455656:    imul   $0x3e8,%rdx,%rdx
0x45565d:    mov    %rax,0x20(%rsp)
0x455662:    mov    %edx,0x28(%rsp)
0x455666:    mov    0x10(%rsp),%rbp
0x45566b:    add    $0x18,%rsp
0x45566f:    retq
0x455670:    sub    $0x18,%rsp
0x455674:    mov    %rbp,0x10(%rsp)
The first thing I did was to use the bt command to analyze how the backtrace looks
like, and then I showed the next 30 lines of Assembly with:
x/30i $pc
All this is not very useful unfortunately but in case of problems it can be of help.
I own the code
On the other hand if you own the code your life is just easier.
In this situation, you’ll likely to have an optimized binary in production that can’t be used for reading the core dump. If this is the case the thing you can do is to compile the same source code without the optimizations and then use the debugger to read the dump file along with it.
With Delve
dlv core ./godebugging core.1234
(dlv) bt
0  0x0000000000455594 in runtime.raise
   at /usr/lib/go/src/runtime/sys_linux_amd64.s:113
1  0x0000000000451f70 in runtime.systemstack_switch
   at /usr/lib/go/src/runtime/asm_amd64.s:298
2  0x0000000000427ac8 in runtime.dopanic
   at /usr/lib/go/src/runtime/panic.go:586
3  0x000000000042765e in runtime.gopanic
   at /usr/lib/go/src/runtime/panic.go:540
4  0x00000000004952d9 in main.main
   at ./main.go:34
5  0x00000000004292a6 in runtime.main
   at /usr/lib/go/src/runtime/proc.go:195
6  0x00000000004545c1 in runtime.goexit
   at /usr/lib/go/src/runtime/asm_amd64.s:2337
Things are so clear, bt is showing that main.go broke at line 34
leading to a panic, let’s see what happened,
the problem seemed to be at frame 4 (the 4 in the backtrace), so I can print the source of that frame:
(dlv) frame 4 list
Goroutine 1 frame 4 at /home/fntlnz/go/src/github.com/fntlnz/godebugging/main.go:34 (PC: 0x4952d9)
    29:         for {
    30:                 select {
    31:                 case message := <-ch:
    32:                         fmt.Println(message)
    33:                 case <-time.After(time.Second * 3):
=>  34:                         panic("I'm panicking because of timeout!")
    35:                 }
    36:         }
    37: }
Wow! That’s a panic, I wrote it so that the program would crash if a timeout occurs, well done program.
Now I’m interested to see the state of the goroutines at the crash
(dlv) goroutines
[6 goroutines]
* Goroutine 1 - User: ./main.go:34 main.main (0x4952d9) (thread 32124)
  Goroutine 2 - User: /usr/lib/go/src/runtime/proc.go:288 runtime.gopark (0x42974c)
  Goroutine 3 - User: /usr/lib/go/src/runtime/proc.go:288 runtime.gopark (0x42974c)
  Goroutine 4 - User: /usr/lib/go/src/runtime/proc.go:288 runtime.gopark (0x42974c)
  Goroutine 5 - User: ./main.go:21 main.producer (0x4950b0)
  Goroutine 6 - User: /usr/lib/go/src/runtime/proc.go:288 runtime.gopark (0x42974c)
Nice, there where six goroutines, a few ones parked too
Between all those goroutines the one t hat seems interesting is the Goroutine 5, let’s see what’s inside:
(dlv) goroutine 5
Switched from 1 to 5 (thread 32124)
(dlv) bt
0  0x000000000042974c in runtime.gopark
   at /usr/lib/go/src/runtime/proc.go:288
1  0x000000000042983e in runtime.goparkunlock
   at /usr/lib/go/src/runtime/proc.go:293
2  0x0000000000403c0b in runtime.chansend
   at /usr/lib/go/src/runtime/chan.go:222
3  0x0000000000403993 in runtime.chansend1
   at /usr/lib/go/src/runtime/chan.go:113
4  0x00000000004950b0 in main.producer
   at ./main.go:21
5  0x00000000004545c1 in runtime.goexit
   at /usr/lib/go/src/runtime/asm_amd64.s:2337
(dlv) frame 4 ls
Goroutine 5 frame 4 at /home/fntlnz/go/src/github.com/fntlnz/godebugging/main.go:21 (PC: 0x4950b0)
    16: }
    17:
    18: func producer(ch chan<- string) {
    19:         for {
    20:                 time.Sleep(time.Second * time.Duration(rand.Intn(4))) // simulate some work
=>  21:                 ch <- messages[rand.Intn(len(messages)-1)]
    22:         }
    23: }
    24:
    25: func main() {
    26:         ch := make(chan string)
When in the Goroutine 5, I can hook in the frame 4 to see the content of the messages and ch variables:
(dlv) frame 4 p ch
chan<- string {
        qcount: 0,
        dataqsiz: 0,
        buf: *[0]string [],
        elemsize: 16,
        closed: 0,
        elemtype: *runtime._type {
                size: 16,
                ptrdata: 8,
                hash: 3774831796,
                tflag: 7,
                align: 8,
                fieldalign: 8,
                kind: 24,
                alg: *(*runtime.typeAlg)(0x5420f0),
                gcdata: *1,
                str: 6602,
                ptrToThis: 55936,},
        sendx: 0,
        recvx: 0,
        recvq: waitq<string> {
                first: *sudog<string> nil,
                last: *sudog<string> nil,},
        sendq: waitq<string> {
                first: *(*sudog<string>)(0xc4200a2000),
                last: *(*sudog<string>)(0xc4200a2000),},
        lock: runtime.mutex {key: 0},}
(dlv) frame 4 p messages
[6]string [
        "There's something that doesn't make sense. Let's go and poke it ...+13 more",
        "We're all stories, in the end.",
        "Bow ties are cool.",
        "One may tolerate a world of demons for the sake of an angel.",
        "You want weapons? We’re in a library! Books! The best weapons ...+13 more",
        "Do what I do. Hold tight and pretend it’s a plan!",
]
With GDB things are similar, but not that nice:
gdb godebugging core.1234
>>> bt
#0  runtime.raise () at /usr/lib/go/src/runtime/sys_linux_amd64.s:113
#1  0x000000000043d10b in runtime.dieFromSignal (sig=6) at /usr/lib/go/src/runtime/signal_unix.go:400
#2  0x000000000043d299 in runtime.crash () at /usr/lib/go/src/runtime/signal_unix.go:482
#3  0x00000000004281b2 in runtime.dopanic_m (gp=0xc420000180, pc=4355678, sp=842350763480) at /usr/lib/go/src/runtime/panic.go:732
#4  0x0000000000450eac in runtime.dopanic.func1 () at /usr/lib/go/src/runtime/panic.go:587
#5  0x0000000000451ff9 in runtime.systemstack () at /usr/lib/go/src/runtime/asm_amd64.s:344
#6  0x000000000042c3a0 in ?? () at /usr/lib/go/src/runtime/proc.go:1070
#7  0x0000000000544100 in runtime.sched ()
#8  0x00007fff47a3d690 in ?? ()
#9  0x0000000000544160 in ?? ()
#10 0x00007fff47a3d680 in ?? ()
#11 0x000000000042c404 in runtime.mstart () at /usr/lib/go/src/runtime/proc.go:1152
#12 0x0000000000451e21 in runtime.rt0_go () at /usr/lib/go/src/runtime/asm_amd64.s:186
#13 0x0000000000000001 in ?? ()
#14 0x00007fff47a3d6c8 in ?? ()
#15 0x0000000000000001 in ?? ()
#16 0x00007fff47a3d6c8 in ?? ()
#17 0x0000000000000000 in ?? ()
A notable point here is proc.go:1070 so I’ll dig into that frame, also it seems that there has been a panic after.
>>> frame 6
#6  0x000000000042c3a0 in ?? () at /usr/lib/go/src/runtime/proc.go:1070
1070	func startTheWorldWithSema() {
>>> l
1065	func mhelpgc() {
1066		_g_ := getg()
1067		_g_.m.helpgc = -1
1068	}
1069
1070	func startTheWorldWithSema() {
1071		_g_ := getg()
1072
1073		_g_.m.locks++        // disable preemption because it can be holding p in a local var
1074		gp := netpoll(false) // non-blocking
What I see is Go code but not mine. Also given that this is a dump of a specific state and not an interactive debugging session I cannot control the state so I can’t even inspect goroutines in such situation.
The most useful thing I can do now is to get a full backtrace dump printed to a file
set logging on
bt full
This creates a gdb.txt file in the current directory where I see that there’s a known variable I can try to print
>>> p main.messages
$1 = {[0] = "There's something that doesn't make sense. Let's go and poke it with a stick.", [1] = "We're all stories, in the end.", [2] = "Bow ties are cool.", [3] = "One may tolerate a world of demons for the sake of an angel.", [4] = "You want weapons? We’re in a library! Books! The best weapons in the world!", [5] = "Do what I do. Hold tight and pretend it’s a plan!"}
However no luck in getting the right place in my own code where the panic occurred :/
The program runs in a Kubernetes cluster
In case your crashed program runs in a kubernetes cluster the good news is that you can just get your core dumps inside the machines and analyze them like if they weren’t containers (unexpected right?).
The bad news is that in case of a cluster with a number of nodes you will need some effort to understand on which node the process crasheed and the way to get the core dump may not be all that straightforward.
However the other good news is that there’s a pull request kubernetes/community#1311 to add a crd just to do that, seems magical!
In the past on this kind of distributed systems (prior to kubernetes), I was used to
write a program to be used in /proc/sys/kernel/core/core_pattern that would write the dumps
to a shared filesystem, usually NFS.